GEOTECHNICAL ENGINEERING1
TAURANGA
HomeLaboratoryGrain size analysis (sieve + hydrometer)

Grain Size Analysis in Tauranga: Sieve & Hydrometer Testing for Site Characterisation

Practical geotechnics, field-tested.

LEARN MORE

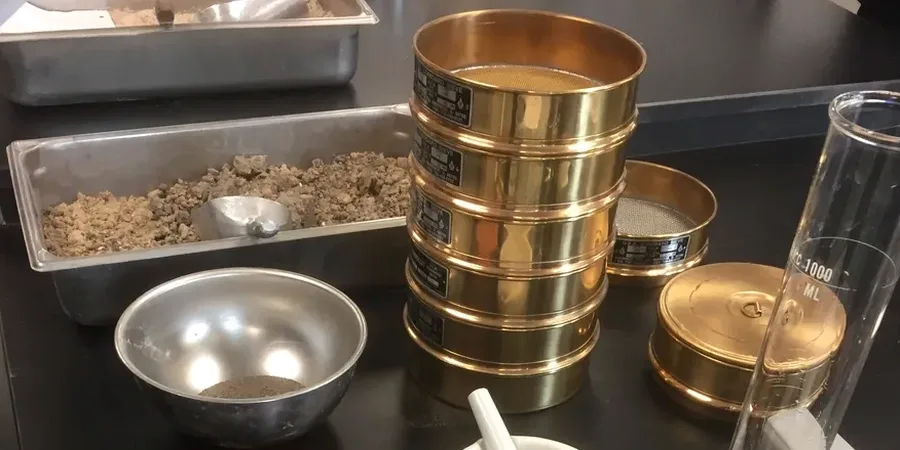
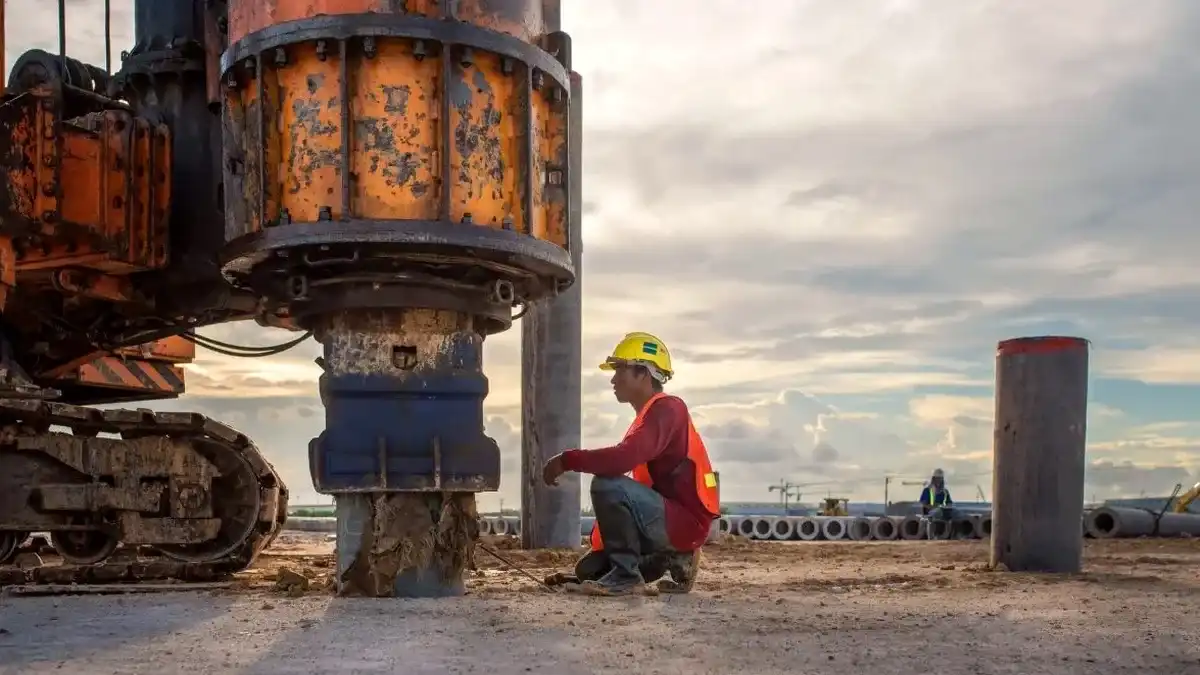
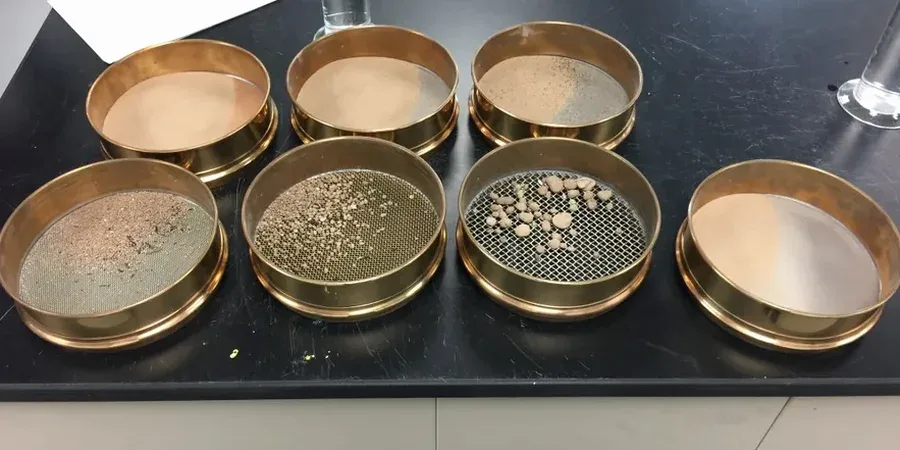
Tauranga’s rapid expansion from a modest port town into one of New Zealand’s fastest-growing cities has pushed development onto increasingly varied terrain, from the volcanic-derived soils of the Kaimai foothills to the estuarine silts that fringe the harbour. With a population now exceeding 160,000 and major infrastructure projects reshaping suburbs like Papamoa and Bethlehem, the need for precise geotechnical data has never been more pressing. Grain size analysis in Tauranga—combining mechanical sieve separation for the coarse fraction and hydrometer sedimentation for fines—provides the fundamental particle distribution curve that underpins nearly every design decision. Whether the project involves a simple test pit investigation near the Wairoa River or a deep SPT drilling campaign in the Mount Maunganui industrial zone, knowing the gradation of the soil across the full range from gravel to clay is the starting point for classifying behaviour, predicting drainage, and assessing liquefaction susceptibility under the NZGS framework.

A single grain size curve tells you more about drainage, frost susceptibility, and seismic response than a dozen borehole logs without it.

Our service areas

Methodology and scope

The geology around Tauranga Harbour creates a distinct challenge for particle sizing because many profiles contain layers of recent alluvium where silt and fine sand dominate, often with traces of organics from former wetland deposits. In our experience, the humidity and frequent rain events across the Bay of Plenty mean samples can arrive with elevated natural moisture that requires careful initial drying at 60°C to avoid altering the clay fraction before testing begins. We run the full combined analysis under standardised procedures, starting with wet sieving through a 63 μm mesh to separate the fine-grained portion for hydrometer analysis using sodium hexametaphosphate as the dispersant. The coarse fraction then goes through a stack of sieves from 75 mm down to 75 μm, with each retained mass weighed to 0.1 g resolution. For projects where the soil exhibits borderline behaviour between silt and clay, we often pair the grain size analysis with Atterberg limits to confirm plasticity characteristics, and when the drainage behaviour of a uniform sand lens needs verification, a field sand cone density test helps correlate gradation with in-place compaction.
Grain Size Analysis in Tauranga: Sieve & Hydrometer Testing for Site Characterisation
Technical reference — Tauranga

Local ground factors

With Tauranga sitting at just 5 metres above mean sea level across much of its developed area and the harbour exerting a strong tidal influence on groundwater, misclassifying a soil’s gradation can cascade into serious design errors. A silty sand that plots just two percent finer on the clay boundary may behave as a liquefiable material under the simplified procedure outlined in the NZGS Module 4 guidelines, whereas the same soil classified as a clayey silt might not trigger the same seismic mitigation requirements. We have seen cases on the Te Papa peninsula where a thin layer of uniformly graded fine sand, invisible in standard split-spoon recovery, showed up clearly in the grain size analysis and forced a redesign of the foundation drainage system. Getting the full curve—not just the sand-silt cutoff—means the difference between an overconfident bearing capacity assumption and a realistic assessment that accounts for potential excess pore pressure during the design earthquake event specified in NZS 1170.5.

Need a geotechnical assessment?

Reply within 24h.

Email: contact@geotechnical-engineering1.co

Reference standards

NZS 4402.6.1.1:1986 – Wet sieving test method, NZS 4402.6.1.2:1986 – Hydrometer test method, NZGS Guideline for Field Classification of Soils, NZS 1170.5:2004 – Seismic actions (liquefaction assessment reference)

Typical values

ParameterTypical value
Coarse analysis range75 mm down to 63 μm (mechanical sieves)
Fine analysis range63 μm down to 2 μm (hydrometer, ASTM 152H)
Sample mass (coarse fraction)500 g minimum for gravel; 200 g for sand
Hydrometer type152H, calibrated at 20°C with meniscus correction
Dispersing agentSodium hexametaphosphate (40 g/L solution)
Minimum fines for hydrometer100 g passing 2.00 mm sieve
Reporting parametersD10, D30, D60, Cu, Cc, % gravel/sand/silt/clay

Quick answers

What is the standard turnaround time for a combined sieve and hydrometer analysis in Tauranga?

For a routine combined test on a single sample, we typically deliver the full particle size distribution curve and NZGS classification within five to six working days from receipt at the laboratory. The hydrometer portion alone requires a minimum 24-hour sedimentation period, plus data reduction time. If you need results faster for an active earthworks operation in Tauranga, we can often expedite the sieve portion within 48 hours and issue a preliminary report while the hydrometer readings finalise.

How much does a grain size analysis cost in the Bay of Plenty region?

A standard combined sieve and hydrometer test on a single sample falls in the range of NZ$170 to NZ$290, depending on whether the sample requires pretreatment for organics or carbonates and how many intermediate sieves are added to the stack. We always quote a firm price after seeing the sample condition, so there are no surprises on the invoice.

Do you need a specific sample size for hydrometer analysis?

Yes—the hydrometer test requires a representative sub-sample of material passing the 2.00 mm sieve, with a dry mass of approximately 100 g for silty soils and 50 g for clay-dominant materials. It is critical that the sample arrives in a sealed, moisture-tight container to preserve the natural water content. For Tauranga sites with high groundwater, we recommend taking the sample from a Shelby tube or undisturbed block rather than a disturbed bag to avoid segregation of fines during transport.

Which NZGS soil groups depend directly on the grain size curve?

The NZGS field classification system uses the particle size distribution as a primary input for all coarse-grained soils—gravels and sands—and for determining the silt versus clay proportion in fine-grained soils. The coefficients of uniformity (Cu) and curvature (Cc) from the curve distinguish well-graded from poorly-graded materials, while the percentage passing 75 μm places the soil into the appropriate group symbol. For borderline cases where the fines content falls between 12% and 50%, we always recommend pairing grain size analysis with Atterberg limit testing to resolve the dual-symbol classification correctly.

Location and service area

We serve projects in Tauranga and surrounding areas.

View larger map